The following infographic shows the most recent data as it pertains to cases reported to the Children’s Authority of Trinidad and Tobago for the month of January 2026.
The dashboard shows a breakdown of the cases reported to the Children’s Authority of Trinidad and Tobago for January 2026. The dashboard shows the number of cases reported to the Authority for the period broken down by sex, age, risk level, protection concerns and location.
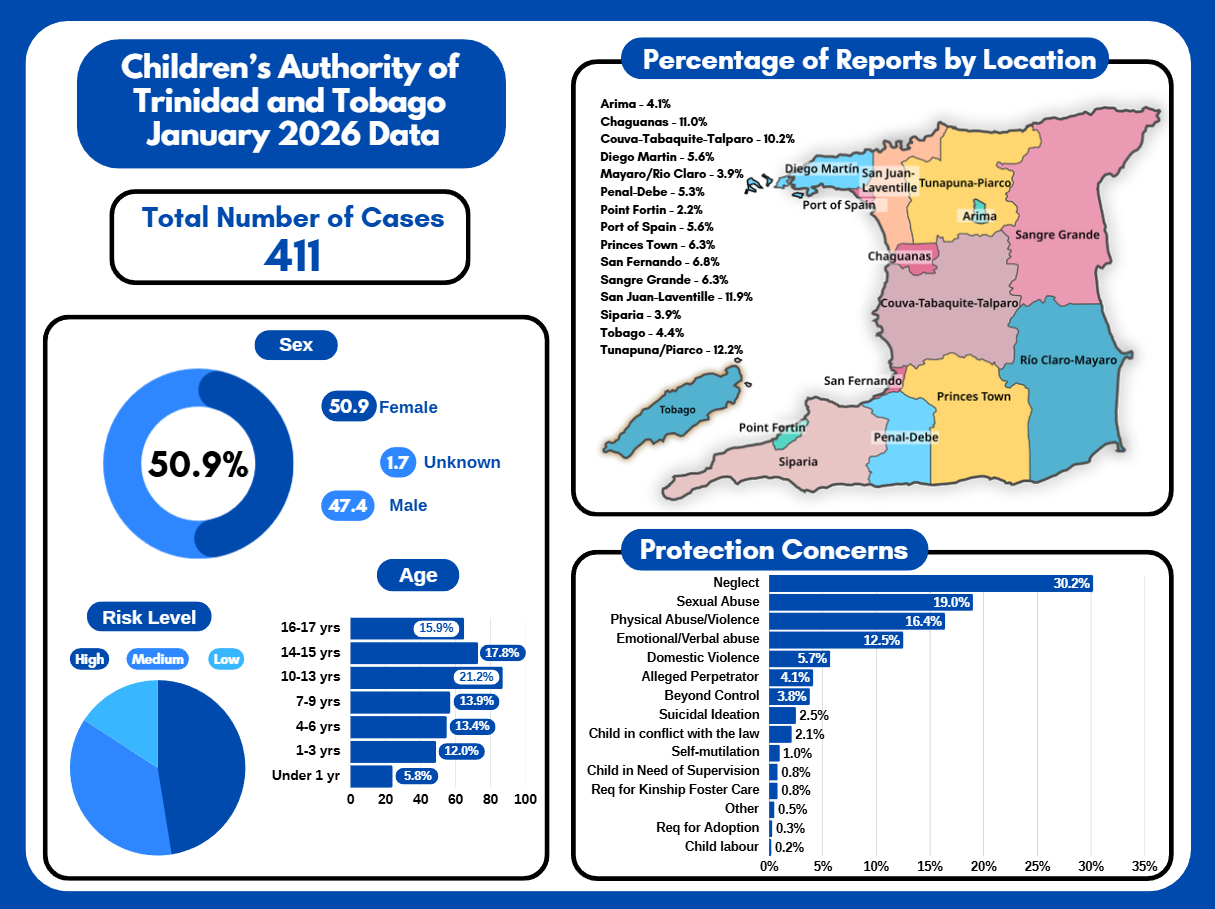
Note – The data used for this graphic was retrieved in February 2026. The Children’s Authority of Trinidad and Tobago’s database is live and continues to be updated on a daily basis, as such figures are often changing.
…………………………………………………………………………………………………………………………………………………………………………………
The following infographic shows the most recent data as it pertains to cases reported to the Children’s Authority of Trinidad and Tobago from October 2025 to December 2025.
The dashboard shows a breakdown of the cases reported to the Children’s Authority of Trinidad and Tobago for October 2025 to December 2025. The dashboard shows the number of cases reported to the Authority for the period broken down by sex, age, risk level, protection concerns and location.
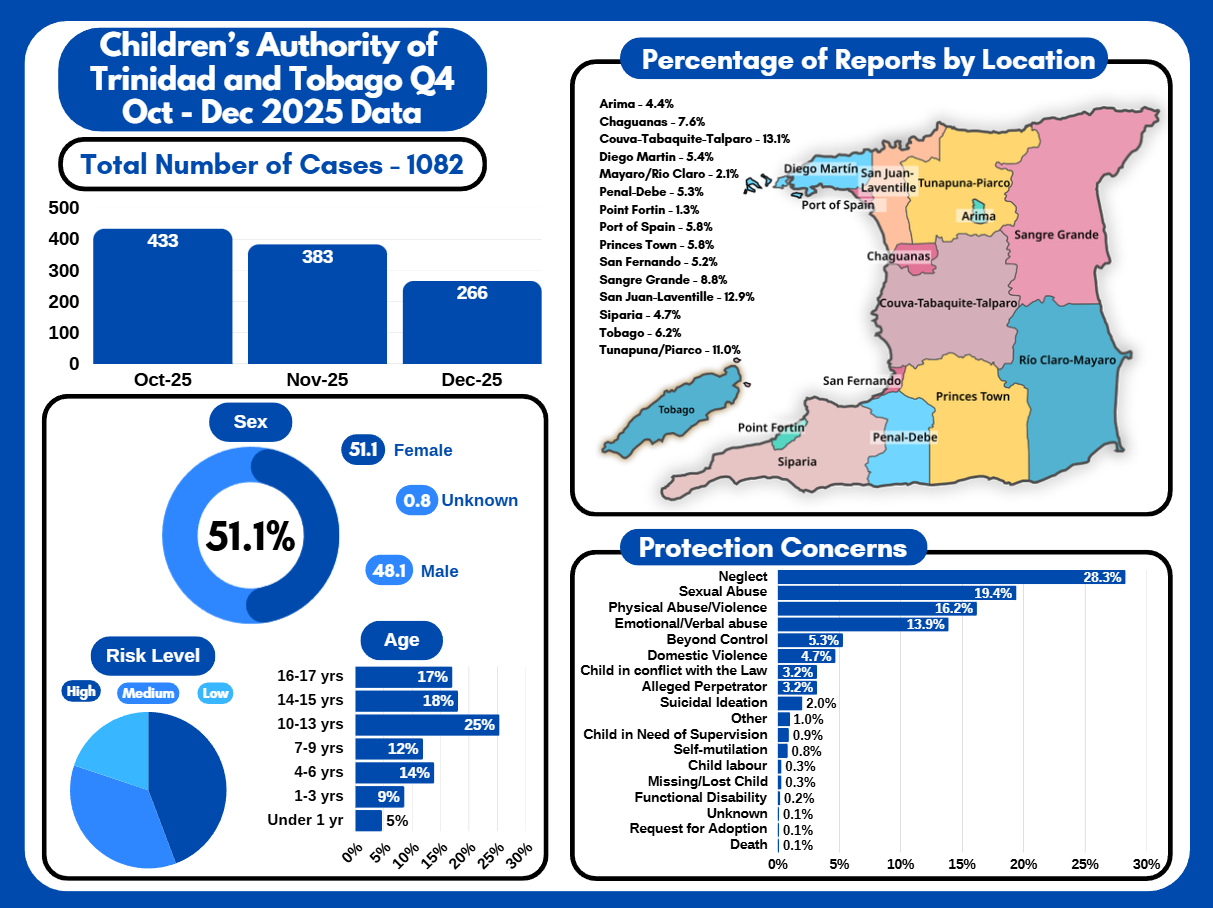
Note – The data used for this graphic was retrieved in December 2025. The Children’s Authority of Trinidad and Tobago’s database is live and continues to be updated on a daily basis, as such figures are often changing.
…………………………………………………………………………………………………………………………………………………………………………………
The following infographic shows the most recent data as it pertains to cases reported to the Children’s Authority of Trinidad and Tobago for the month of December 2025.
The dashboard shows a breakdown of the cases reported to the Children’s Authority of Trinidad and Tobago for December 2025. The dashboard shows the number of cases reported to the Authority for the period broken down by sex, age, risk level, protection concerns and location.
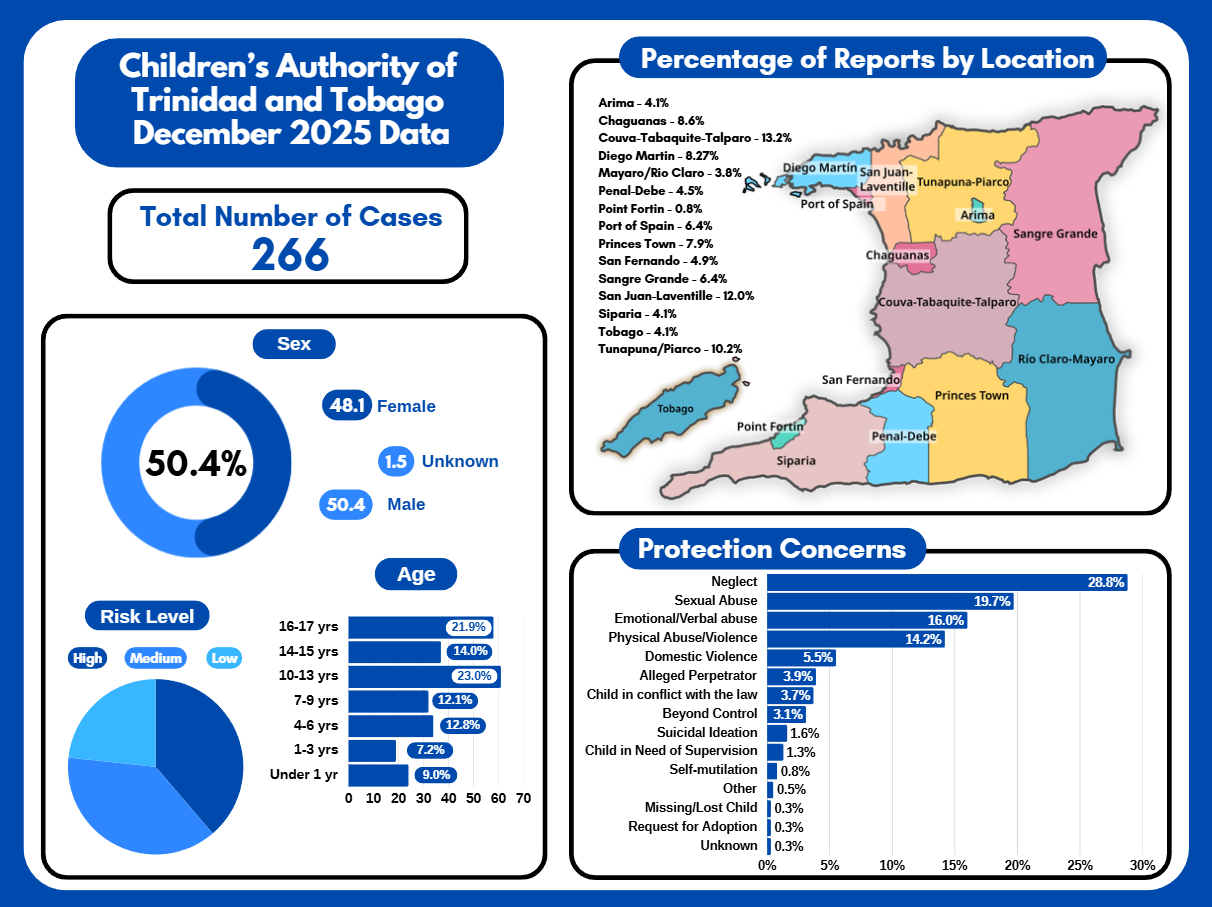
Note – The data used for this graphic was retrieved in January 2026. The Children’s Authority of Trinidad and Tobago’s database is live and continues to be updated on a daily basis, as such figures are often changing.
…………………………………………………………………………………………………………………………………………………………………………………
The following infographic shows the most recent data as it pertains to cases reported to the Children’s Authority of Trinidad and Tobago for the month of November 2025.
The dashboard shows a breakdown of the cases reported to the Children’s Authority of Trinidad and Tobago for November 2025. The dashboard shows the number of cases reported to the Authority for the period broken down by sex, age, risk level, protection concerns and location.
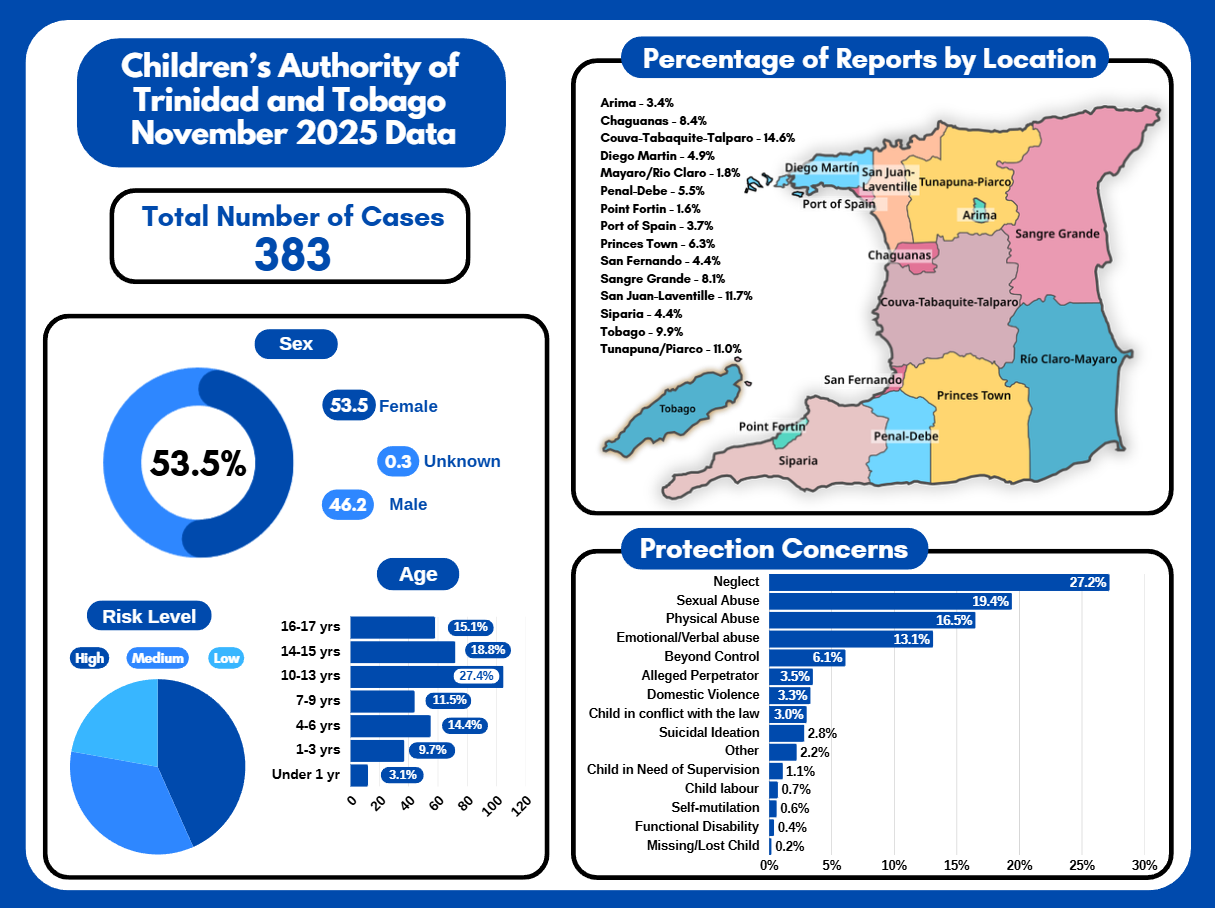
Note – The data used for this graphic was retrieved in December 2025. The Children’s Authority of Trinidad and Tobago’s database is live and continues to be updated on a daily basis, as such figures are often changing.
…………………………………………………………………………………………………………………………………………………………………………………
The following infographic shows the most recent data as it pertains to cases reported to the Children’s Authority of Trinidad and Tobago for the month of October 2025.
The dashboard shows a breakdown of the cases reported to the Children’s Authority of Trinidad and Tobago for October 2025. The dashboard shows the number of cases reported to the Authority for the period broken down by sex, age, risk level, protection concerns and location.
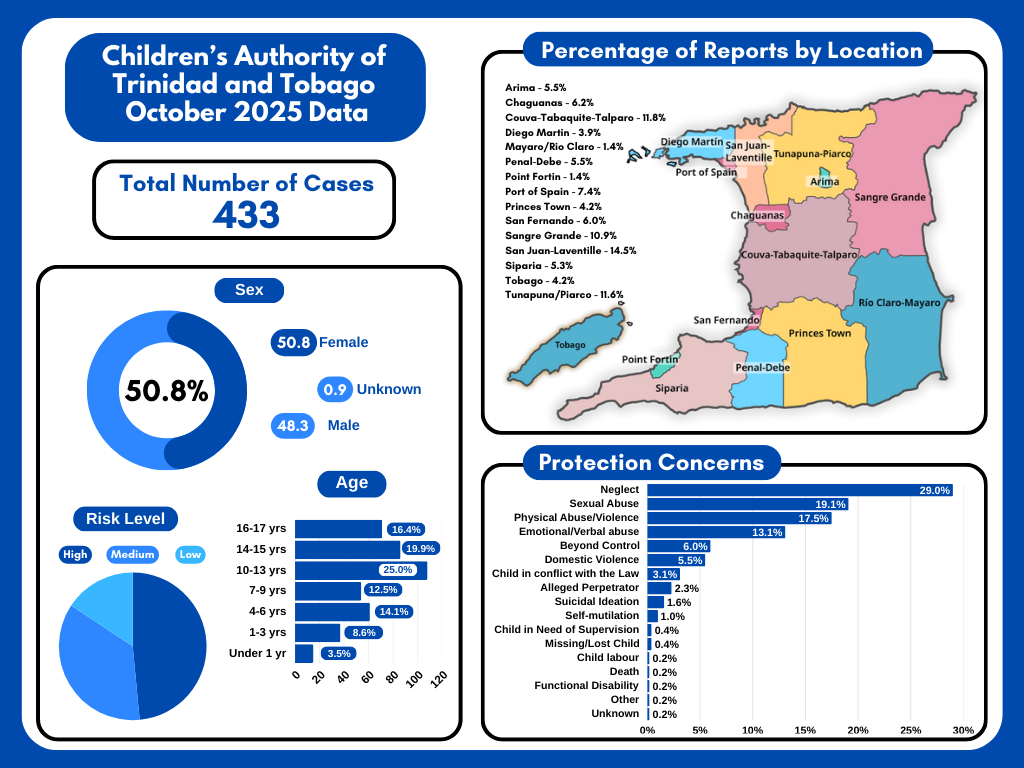
Note – The data used for this graphic was retrieved in November 2025. The Children’s Authority of Trinidad and Tobago’s database is live and continues to be updated on a daily basis, as such figures are often changing.
…………………………………………………………………………………………………………………………………………………………………………………
The following infographic shows the most recent data as it pertains to cases reported to the Children’s Authority of Trinidad and Tobago from July 2025 to September 2025.
The dashboard shows a breakdown of the cases reported to the Children’s Authority of Trinidad and Tobago for July 2025 to September 2025. The dashboard shows the number of cases reported to the Authority for the period broken down by sex, age, risk level, protection concerns and location.
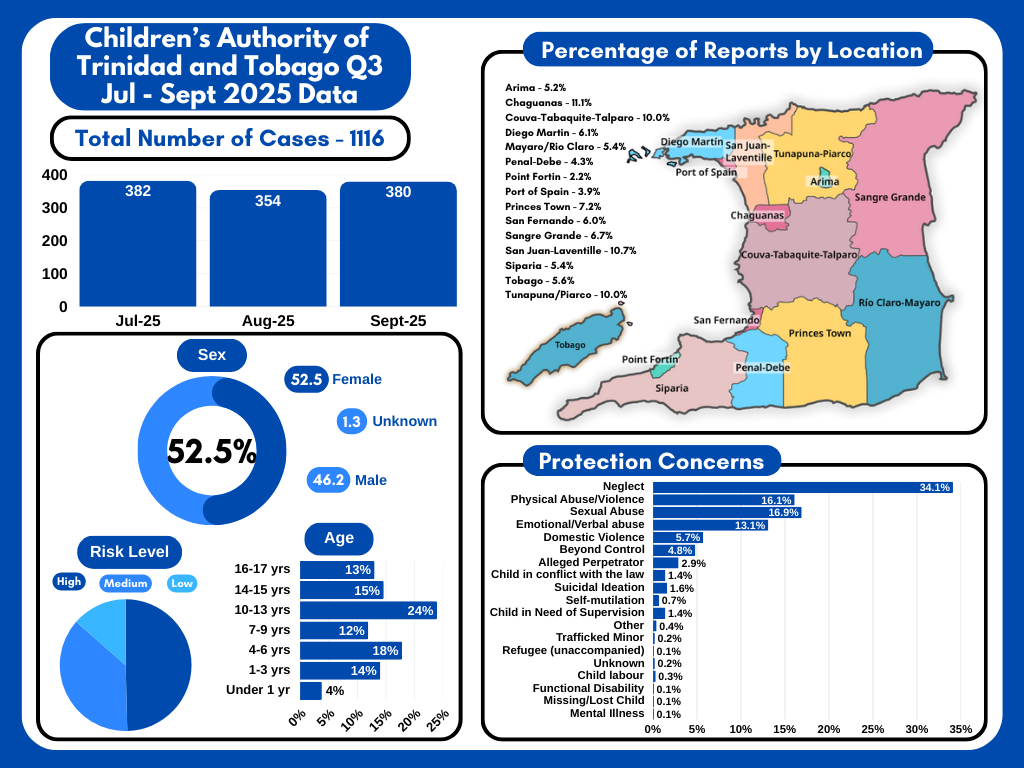
Note – The data used for this graphic was retrieved in October 2025. The Children’s Authority of Trinidad and Tobago’s database is live and continues to be updated on a daily basis, as such figures are often changing.
…………………………………………………………………………………………………………………………………………………………………………………
The following infographic shows the most recent data as it pertains to cases reported to the Children’s Authority of Trinidad and Tobago from April 2025 to June 2025.
The dashboard shows a breakdown of the cases reported to the Children’s Authority of Trinidad and Tobago for April 2025 to June 2025. The dashboard shows the number of cases reported to the Authority for the period broken down by sex, age, risk level, protection concerns and location.
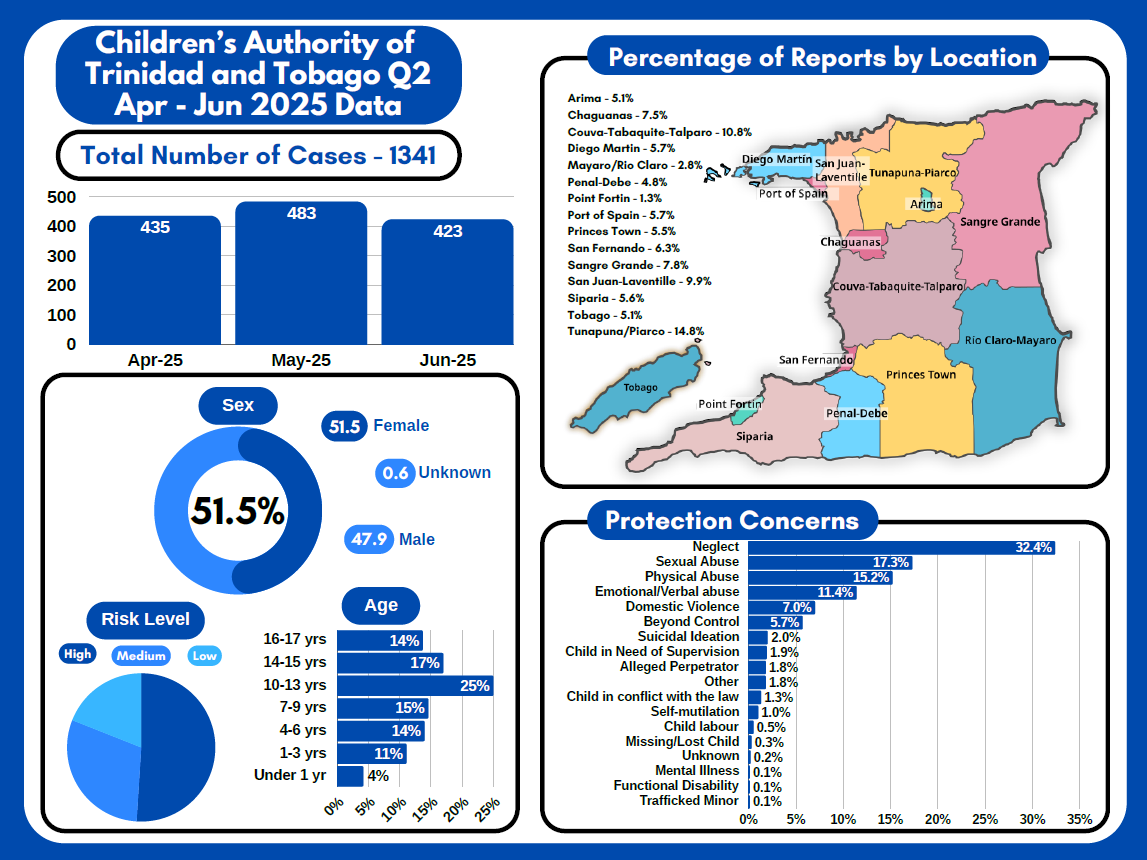
Note – The data used for this graphic was retrieved in April 2025. The Children’s Authority of Trinidad and Tobago’s database is live and continues to be updated on a daily basis, as such figures are often changing.
…………………………………………………………………………………………………………………………………………………………………………………
The following infographic shows the most recent data as it pertains to cases reported to the Children’s Authority of Trinidad and Tobago from January 2025 to March 2025.
The dashboard shows a breakdown of the cases reported to the Children’s Authority of Trinidad and Tobago for January 2025 to March 2025. The dashboard shows the number of cases reported to the Authority for the period broken down by sex, age, risk level, protection concerns and location.
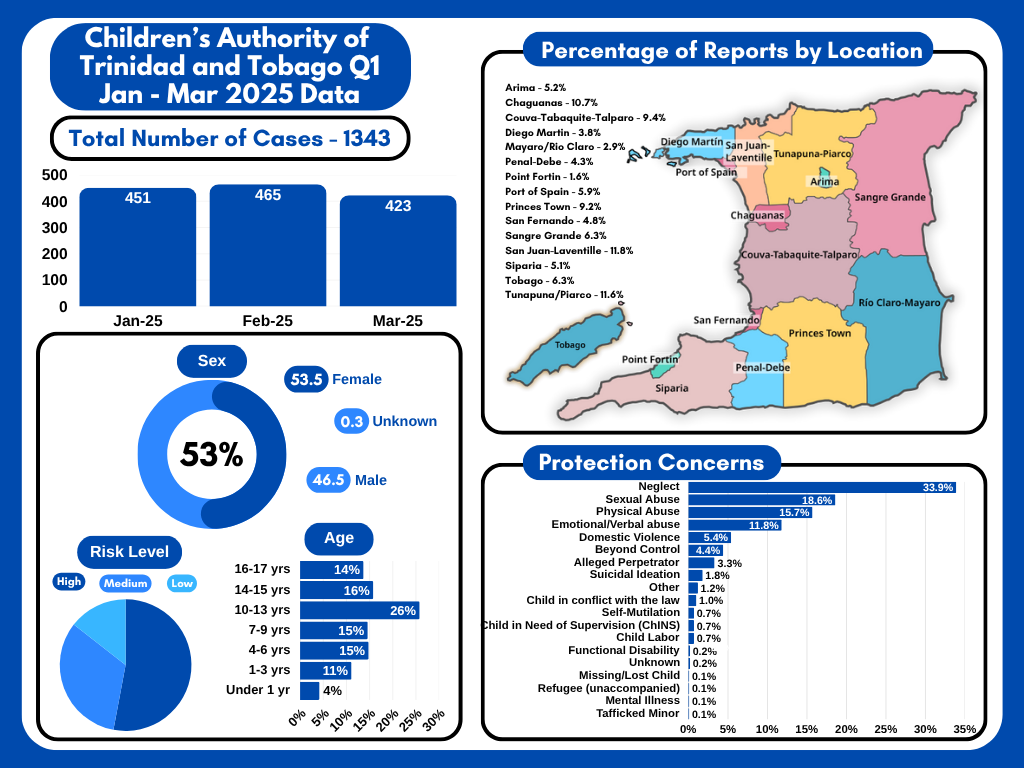
Note – The data used for this graphic was retrieved in March 2025. The Children’s Authority of Trinidad and Tobago’s database is live and continues to be updated on a daily basis, as such figures are often changing.
…………………………………………………………………………………………………………………………………………………………………………………
The following infographic shows the most recent data as it pertains to cases reported to the Children’s Authority of Trinidad and Tobago from January 2024 to December 2024.
The dashboard shows a breakdown of the cases reported to the Children’s Authority of Trinidad and Tobago for January 2024 to December 2024. The dashboard shows the number of cases reported to the Authority for the period broken down by sex, age, risk level, protection concerns and location.
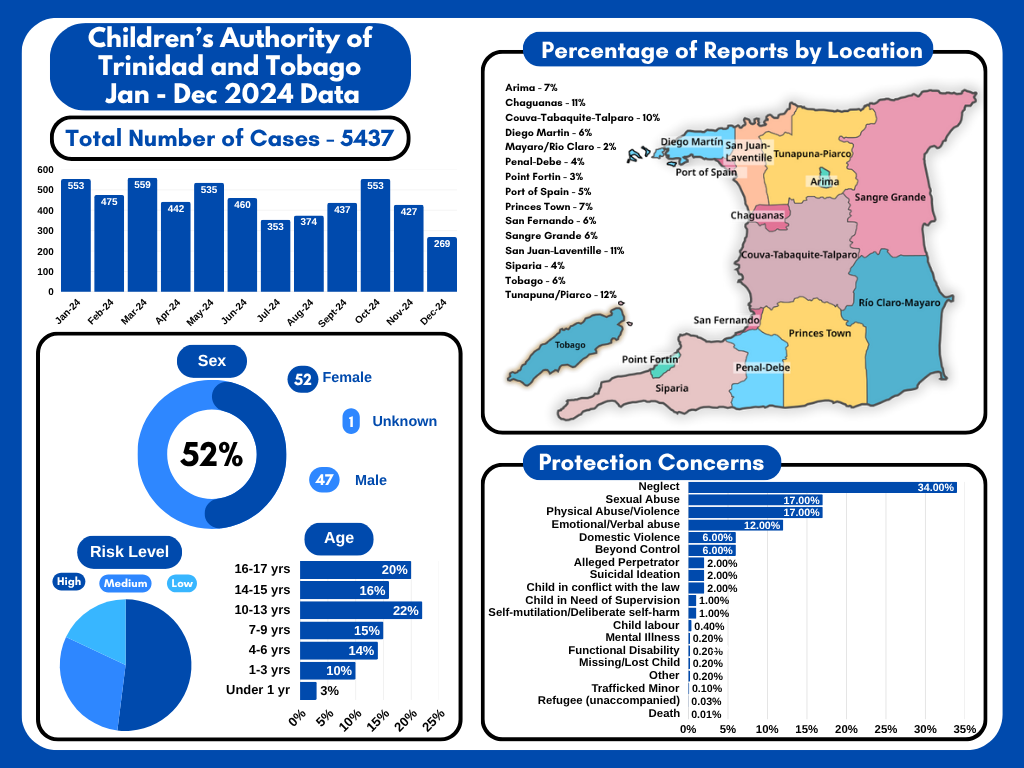
Note – The data used for this graphic was retrieved in January 2025. The Children’s Authority of Trinidad and Tobago’s database is live and continues to be updated on a daily basis, as such figures are often changing.